Projects with which we have been significantly involved with include:
Defence quantitative risk analysis (QRA)
Individuals now working for Andcer have determined the likely cost outcomes and associated cost risks for many major projects. Some of the larger... see below
Defence Fixed High Frequency Radio Replacement (cost modelling, and data discovery)
The New Zealand Defence Force (NZDF) is replacing its legacy domestic high frequency radio system. This system... see below
Defence light aircraft Beechcraft 200 (economic cost studies)
The New Zealand Defence Force had a fleet of B200 aircraft (more). These aircraft were leased, and were mainly used for aircrew... see below
NZDF sizing of aircraft engine inventory (QRA-logistics)
High end military aircraft engines are expensive. Too many engines on inventory incurs excessive costs and creates a capability that... see below
Telecommunications (regulatory cost model)
Telecom New Zealand (TNZ) (now Chorus and Spark) provided their regulator, the New Zealand Commerce Commission, with a cost model showing the costs of... see below
NZDF high capacity mobile communications (demand and economic cost model)
WGS (Wideband Global Satellite communications) is a high capacity communications system owned and controlled by the... see below
Defence policy (optimisation)
Policy and policy related discussions are often performed without the benefit of quantifying the economic cost and benefit of numerical optimisation.
Policy is... see below
Statistics: tools to detect fraud [the value is in the detail]
Curiosity is probably the analyst's best friend in examining data for fraud or in any modelling. Analysis of data is about finding... see below
ACC organisational performance measurement
At the time of this study, ACC (the Accident Compensation Corporation) had approximately 33 main branches. Each branch was largely autonomous in its... see below
Police-organisational performance measurement
The New Zealand Police have many Policing Areas distributed around New Zealand. This study examined the contribution of each Area to the overall... see below
Department of Labour (currently MBIE) Immigration Office Performance
Data Envelopment Analysis (DEA) was used as the base technique to assess Immigration Office organisational performance. ... see below
Defence quantitative risk analysis (QRA)
Individuals now working for Andcer have determined the likely cost outcomes and associated cost risks for many major projects. Some of the larger projects they provided QRA for include:
protected mobility: this involved assessing cost and associated cost risks for a planned refresh of all New Zealand Defence Force (NZDF) land vehicles on reaching the end of their economic. These vehicles ranged from quad bikes through small vehicles, and trucks to large armoured vehicles;
frigate systems upgrade: the NZDF is currently refurbishing its frigates,
(more). We provided analysis in support of this decision;
ANZAC communications upgrade: the NZDF frigates provide communications for locally deployed and remote assets this project resulted in improved cost estimates; and
Telecom New Zealand (TNZ): this work involved setting product tariffs while acknowledging uncertainty in some of the factors important to setting these tariffs.
Quantitative Risk Assessment applied to cost models and business cases
Numbers describe the world around us. A new car might be expected to cost $30,000 ± 10%. The distance to Alpha Centauri is 41.32 trillion km ± 5 thousand million km. Numbers have uncertainties attached them, an uncertainty may be zero. An uncertainty is represented by a statistical distribution. Many distributions are available reflecting the nature of the risk being modelled. The following four distributions are commonly encountered in QRA:
risk type
description
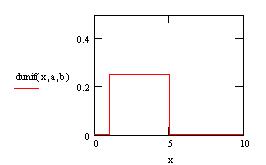
uniform distribution
A uniform distribution is arguably the simplest distribution. It is characterised by a maximum and a minimum (cost). All costs between the maximum and minimum are equally likely. The distribution is continuous between the maximum and minimum. This example is a quantity between 1 and 5. This quantity could be an estimate where nothing more than the upper and lower estimates are known.
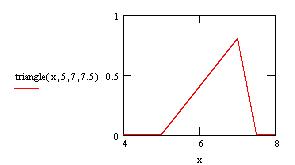
triangular distribution
A triangular distribution, at least as related to cost estimates, places an upper and a lower limit on the costs. Unlike the uniform distribution the probability is reduced at the ends. This recognises that there is a lowered probability of a result being at either the upper or lower limit. A Triangular Distribution is characterised by a lower and upper limit, but also by a mode. The mode is the apex of the triangle it represents the most common/ most likely estimate of a parameter. The distribution is continuous. This example is a quantity between 5 and 7.5 with a mode of 7. This indicates that the quantity is expected to be around 7 but may be as high as 7.5 and as low as 5.
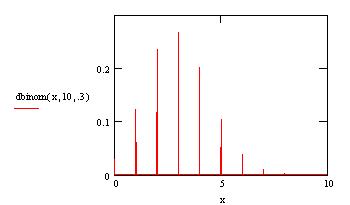
binomial distribution
This distribution is binomial, it is not continuous. An example of a binomial distribution might be throwing a dice or flipping a coin, or the possibility that phase of a project did not meet specification. Within the above distribution's constraints, it is always possible to go a "little" higher or lower. Only certain outcomes are possible eg pass/fail or, in this case, integer values 1 to 10. A binominal distribution is very important as they are used to model events such as the probability that an event occurs.
The modelled distribution shows the cumulative probability of an event with 10 trials (attempts) and an individual probability of success of 1/3.
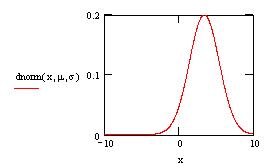
normal distribution
A normal distribution is perhaps the most mature distribution. A normal distribution is used when sufficient experience and knowledge is available to calculate an estimate of the population mean and standard deviation. This might occur if say there were hundreds of individual observations of a metric.
The mean μ is 3.4 and the variance σ is 2.0. This metric could be produced as the cost of one hundred widgets purchased by an organisation.
QRA is a technique which uses subject matter experts to ascertain the risks associated with various estimates and produces an aggregate impact of all the potential risks on both the project cost and the project timeline. A QRA would typically produce the following:
Original cost estimate;
Optimism bias correction - this correction removes identified biases from the orginal cost estimate; and
95th (or other agreed) percentile unlikely to exceed cost - this correction is applied to the total of the original cost + optimism bias correction.
In the case of an organisation modelling one purchase of 10 cars at $30,000 each the QRA reported costs might look like:
parameter
unit parameter estimate
comments
original cost estimate
$30,000
This estimate has been provided by vendors.
optimism bias correction
+7,000
Uncertainties have been identified that result in a cost increase.
contingency unlikely to exceed cost
+ $3000 at a 95% Confidence Level
An optimism bias has increased the expected cost of the vehicle. There is still uncertainty in the cost. A contingency should be held against an adverse (statistical) cost movement at the time that the purchase occurs. NB the risk appetite correction is also stated; in this case it was 95%.
The process takes the original cost estimate of $30,000 by removing an optimism bias the unit cost increased it to $37,000. The $37,000 becomes the best guess at the unit cost. The cost has equal up and downside risks. Statistical variation has left uncertainty in this cost; a contingency at an agreed confidence interval should be held. In this example the unlikely to exceed (95th percentile) cost is $40,000 per unit. The total cost of this one purchase of 10 vehicles is unlikely to exceed $400,000.
The top three skills required and used for QRA are: